

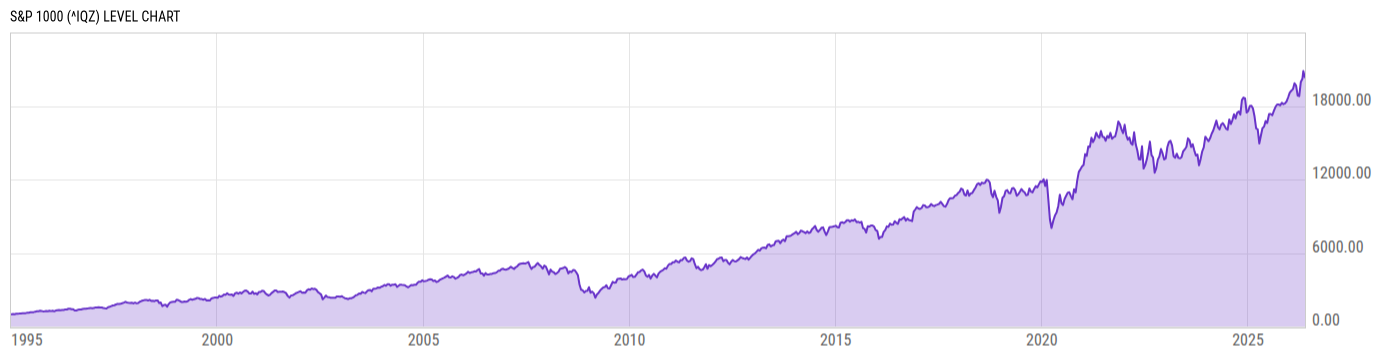
S&P 1000 (^IQZ)
20150.16
-335.24
(-1.64%)
USD |
May 15, 20:00
Level Chart
Key Stats
Basic Info
| The S&P 1000 index (Standard and Poor's) combines the securities in the S&P 400 MidCap and the S&P 600 SmallCap. This index can be used to track the performance of non-large cap companies. | |
| Core Index Name | S&P 1000 |
| Return Type | Price Return |
| Currency Code | USD |
| Category Hedge Type | Not Hedged |
Index Varieties
| Return Types | |
| Net Total Return | S&P 1000 Net Total Return |
| Total Return | S&P 1000 Total Return |
Total Return Performance
As of May 15, 2026.
Returns for periods of 1 year and above are annualized.
Annual Performance
As of May 16, 2026.
Basic Info
| The S&P 1000 index (Standard and Poor's) combines the securities in the S&P 400 MidCap and the S&P 600 SmallCap. This index can be used to track the performance of non-large cap companies. | |
| Core Index Name | S&P 1000 |
| Return Type | Price Return |
| Currency Code | USD |
| Category Hedge Type | Not Hedged |
Index Varieties
| Return Types | |
| Net Total Return | S&P 1000 Net Total Return |
| Total Return | S&P 1000 Total Return |